Benchmarks
Comparisons against other propagation engines and internal regression benchmarks.
Comparisons with other open-source Pauli and Majorana propagation engines, and an internal pytest suite for detecting regressions.
Results
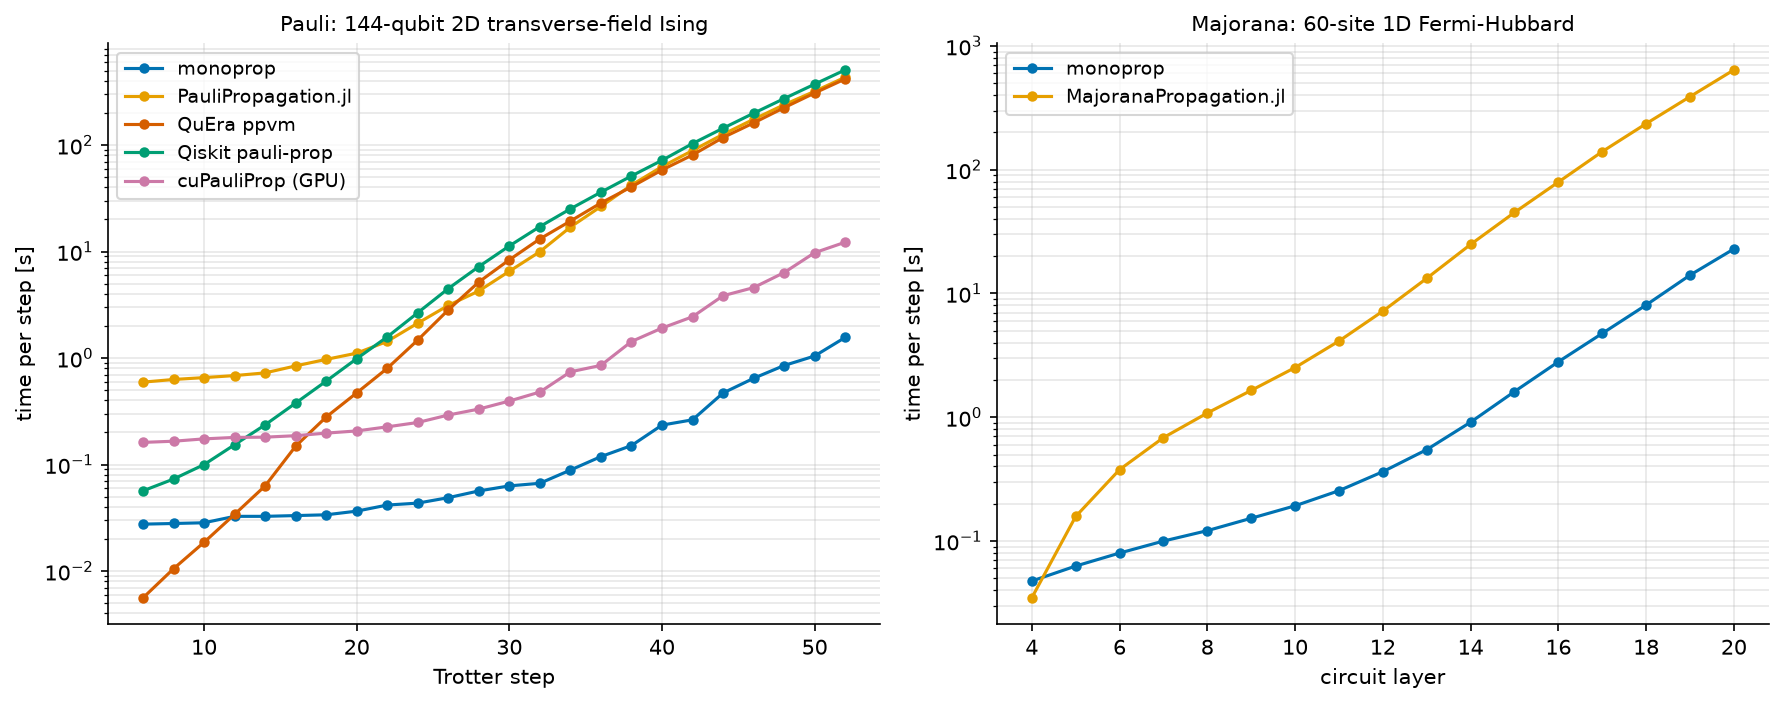
Wall-clock time per step, logarithmic. Final Pauli step, ratios to monoprop: 267-325× for the
other CPU implementations, 7.8× for the GPU one. Complete Majorana evolution: 27.7× for
MajoranaPropagation.jl 0.4.1.
All results are from exclusive nodes on Leonardo (CINECA); conditions under Methods.
Pauli propagation
Trotterized evolution of a 2D transverse-field Ising model, evaluating a ZZ correlator on a fixed
qubit pair. One experiment varies depth, the other lattice size.
Fixed lattice, increasing depth
12×12 lattice (144 qubits), 28 Trotter points, dt = 0.05, coefficient threshold 1e-6, no weight
cutoff; ~33 million terms at the end.
| Engine | Final step | VS monoprop | Peak RSS | VS monoprop |
|---|---|---|---|---|
monoprop | 1.56 s | — | 4275 MB | — |
cuPauliProp (GPU) | 12.23 s | 7.8× | 11652 MB (device) | 2.7× |
QuEra ppvm | 417.29 s | 267× | 6956 MB | 1.6× |
PauliPropagation.jl | 433.16 s | 277× | 11102 MB | 2.6× |
Qiskit pauli-prop | 507.74 s | 325× | 34270 MB | 8.0× |
Observables differ by at most 3.8e-4 among the coefficient-threshold implementations; 2.8e-3 for
Qiskit pauli-prop, which truncates by term count instead. cuPauliProp's column is peak device
allocation, its operator being on the GPU; its host RSS was 552 MB.
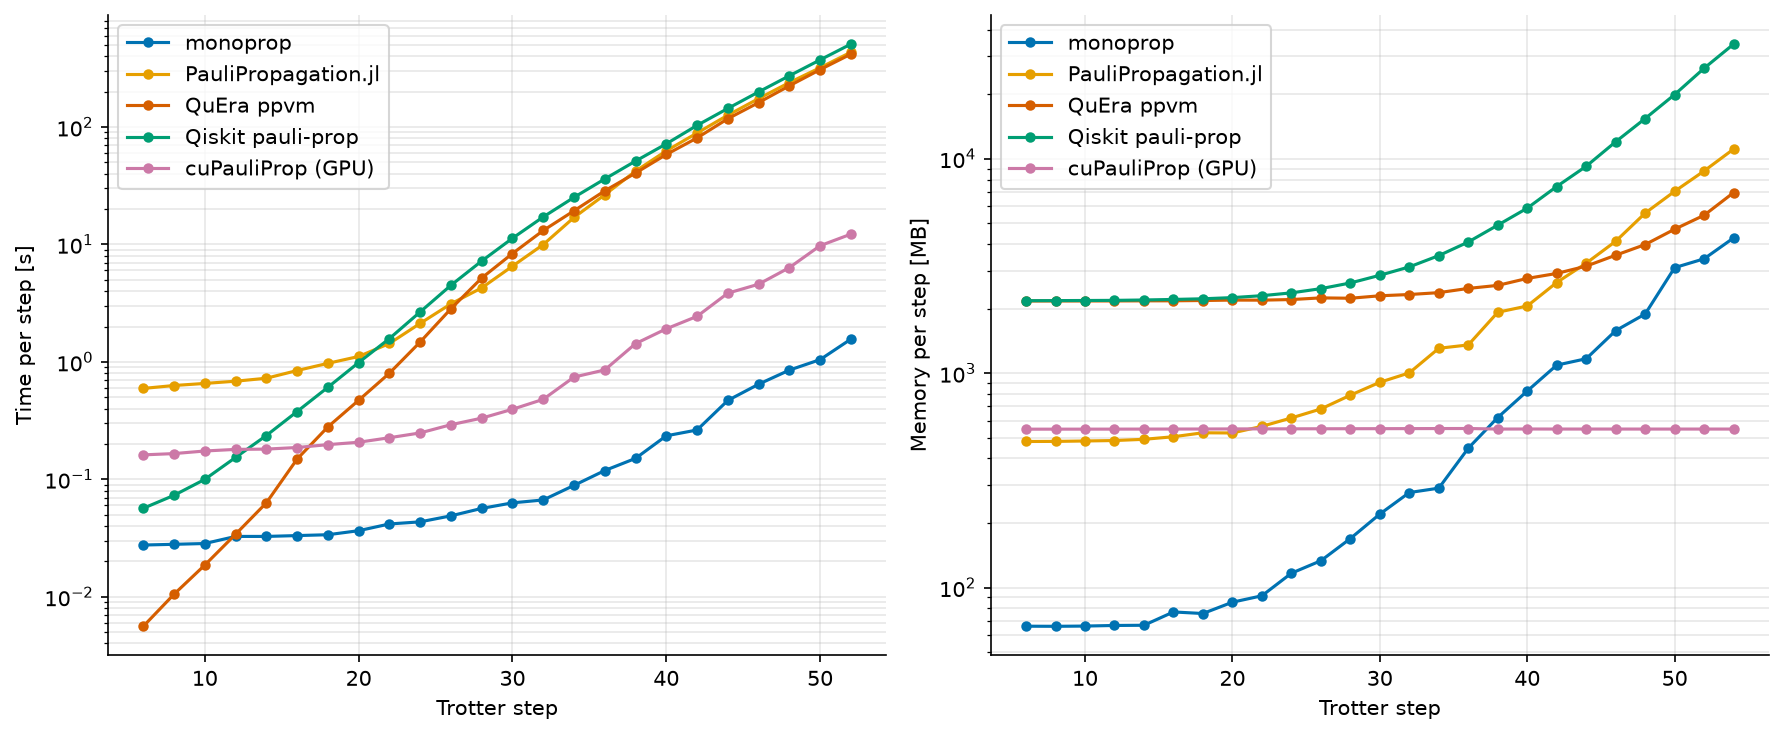
Per Trotter step; cuPauliProp reports peak GPU allocation.
Increasing lattice size
Depth and threshold fixed, lattice 6×6 (36 qubits) to 18×18 (324 qubits), one subprocess per (size,
implementation) under a 300 s limit. That limit — not the implementations — excludes QuEra ppvm and
Qiskit pauli-prop everywhere, PauliPropagation.jl above 10×10.
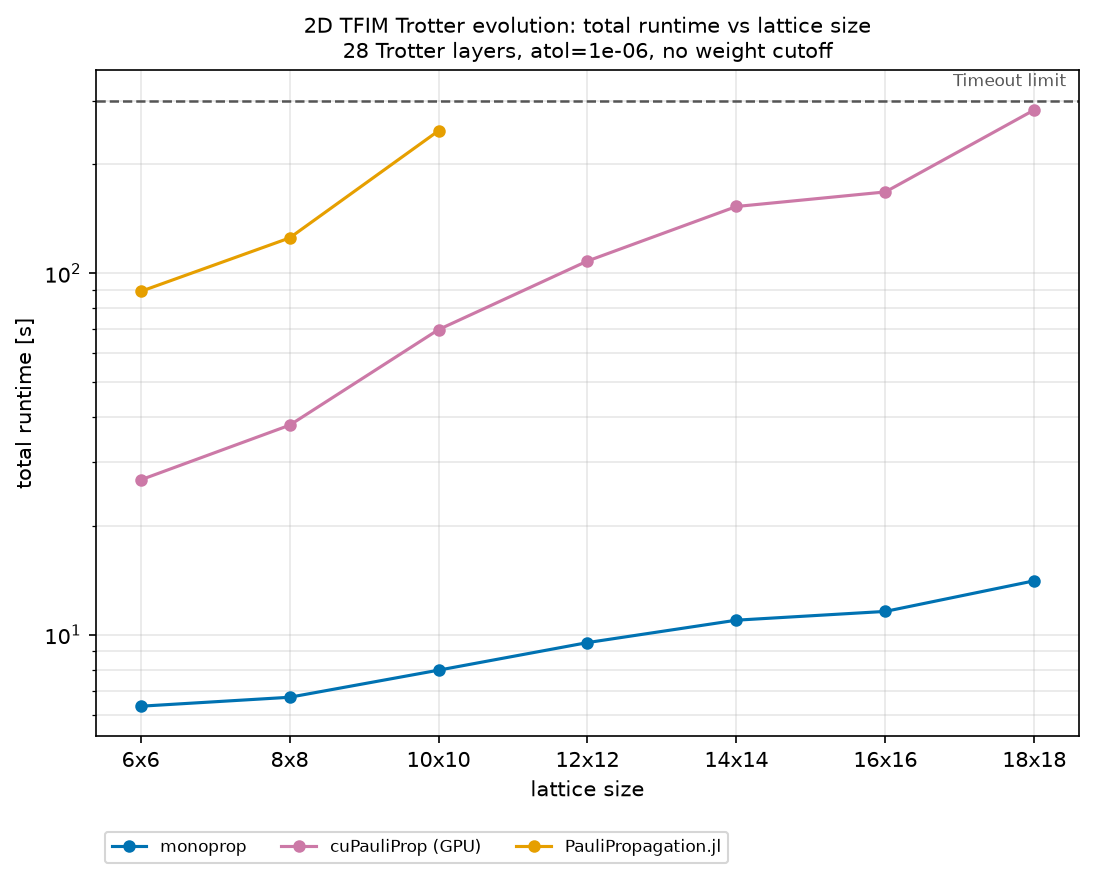
The operator saturates at ~55.0 million terms above 100 qubits, so beyond that this measures cost
per retained term. monoprop: 6.35 s to 14.1 s (2.2×) over a 9× rise in qubits.
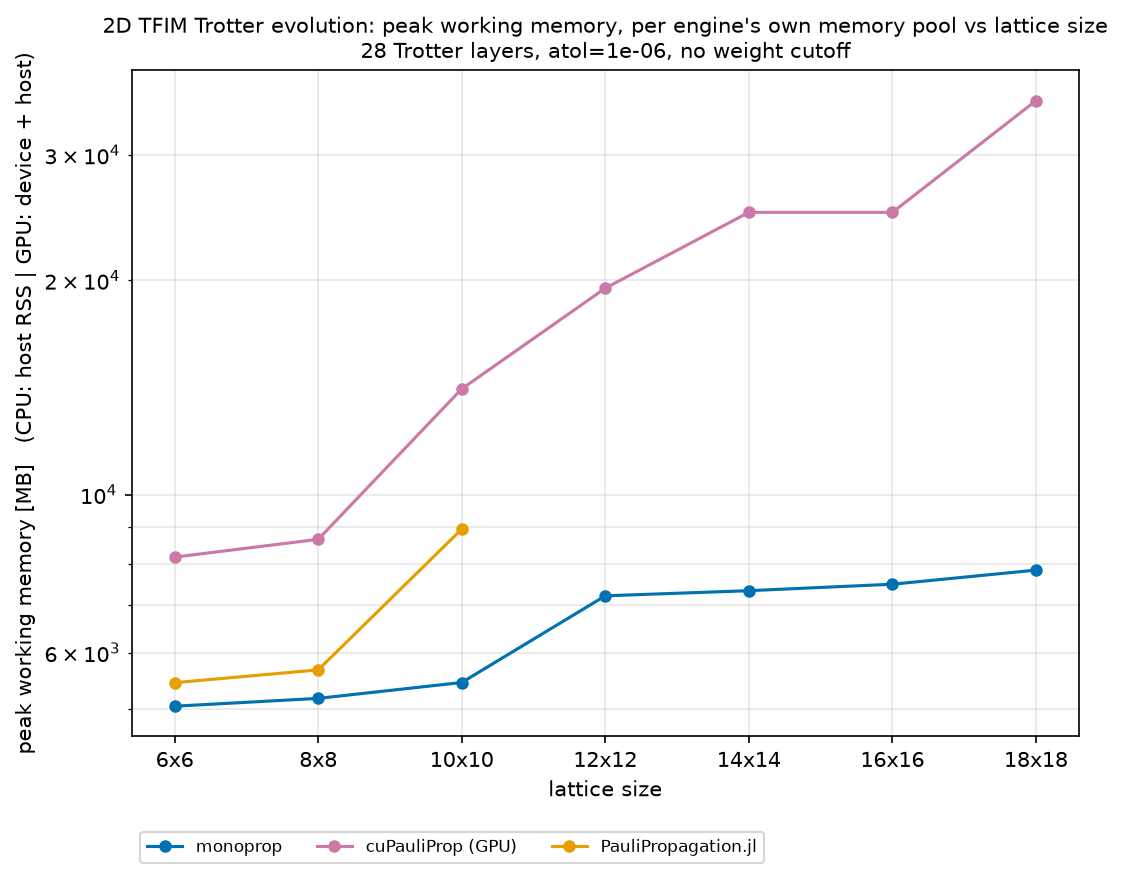
Working memory: peak host RSS for CPU, peak device allocation for cuPauliProp. monoprop 5045
MB to 7835 MB (1.55×), cuPauliProp 7.6 GB to 34.4 GB. At 324 qubits the latter is 4.5× the
monoprop host footprint, over half of the A100's 64 GB.
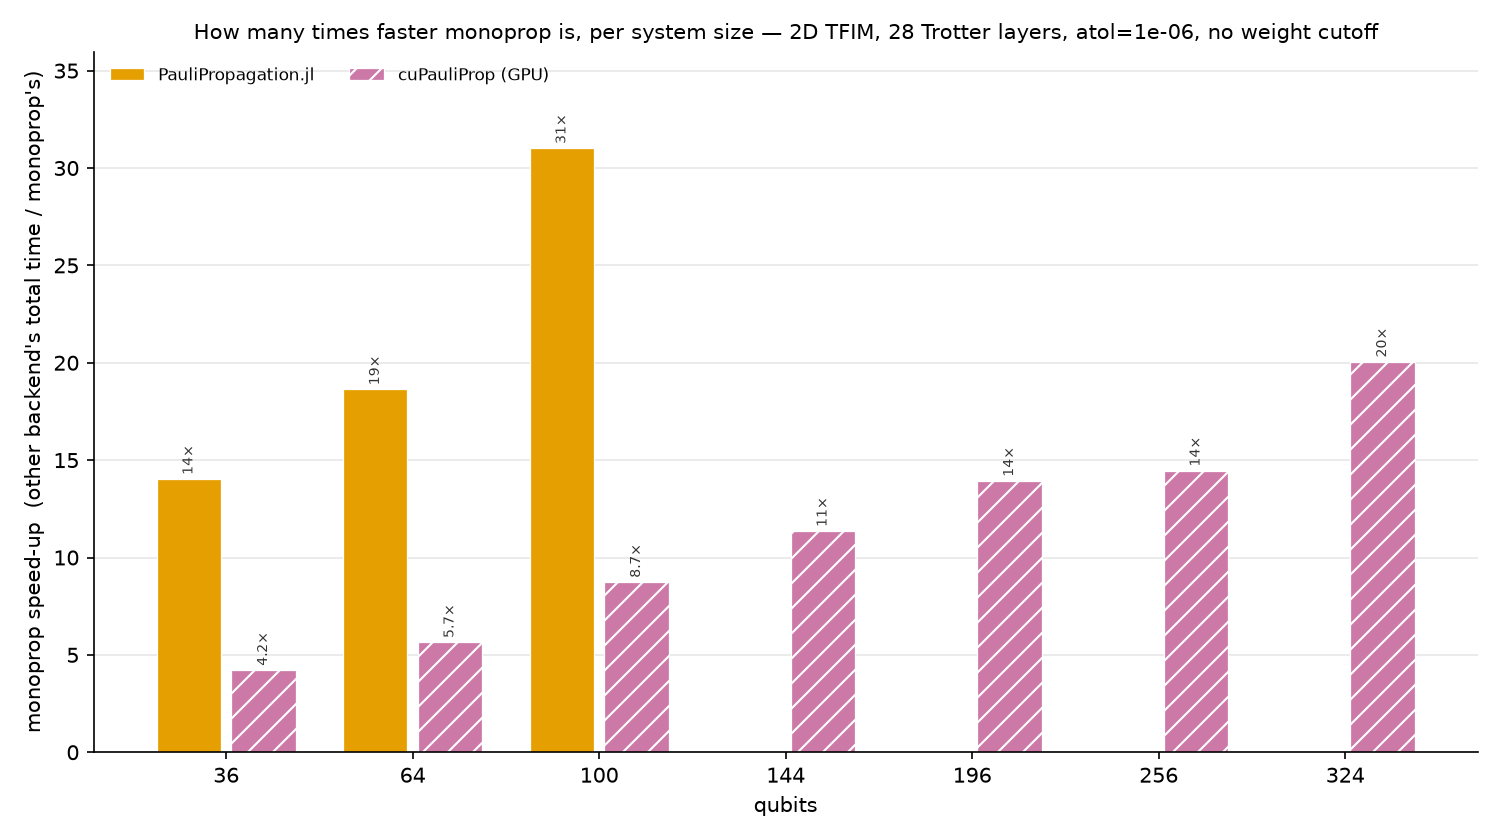
Ratios to monoprop: 14× to 31× for PauliPropagation.jl over its completed points, 4.2× to 20×
for cuPauliProp over the full range. A missing bar is a run past the 300 s limit.
Majorana propagation
20 Trotter layers of a 1D Fermi-Hubbard model, 60 spinful sites, 24 threads both sides; runtime, expectation value, term count and memory recorded per layer.
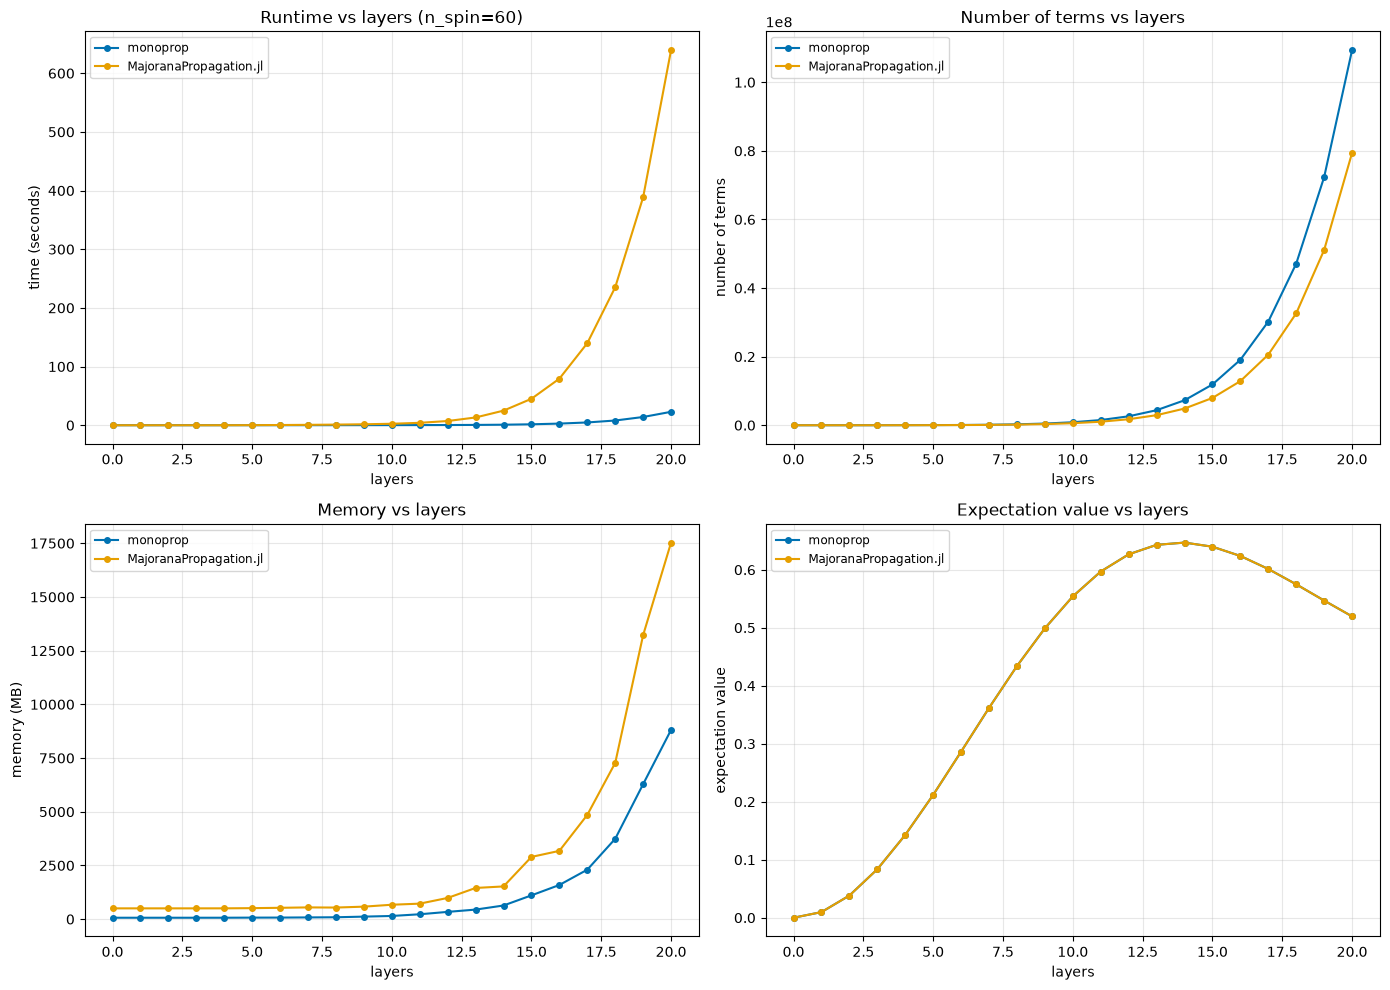
Expectation values differ by at most 2.0e-6 at every layer. At equal truncation monoprop retains
109.4 million terms against 79.4 million. Complete evolution 57.1 s against 1583.7 s (27.7×);
final layer 22.9 s against 639.4 s (27.9×). Peak RSS 8.8 GB and 17.5 GB.
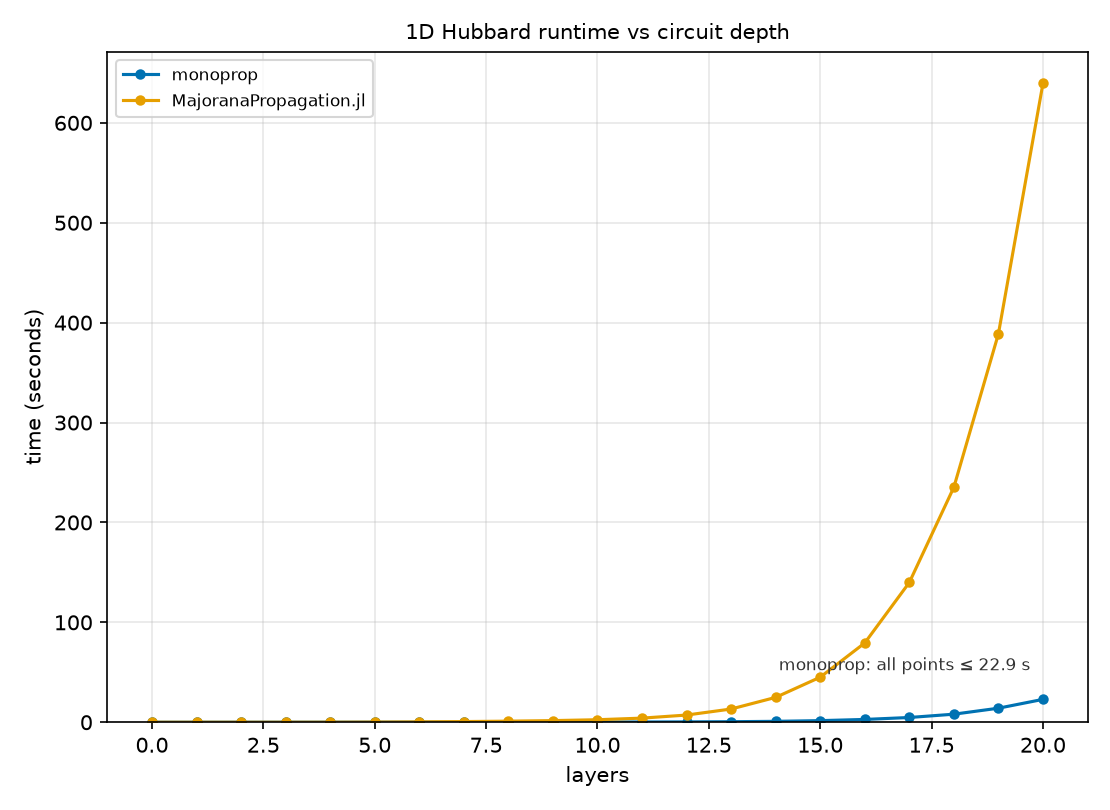
Linear scale. The annotation bounds the monoprop curve, which otherwise lies near the axis.
Caveats
- CPU parallelism differs, so these are wall-clock ratios, not per-core ones.
QuEra ppvmandQiskit pauli-proppropagate on one core (0.99 measured active cores); theppvmbindings expose the serialindexmapvariant rather than the Rayon-parallelconfig::dashmap, and Qiskit's_acceleratehas no parallel propagation path. - The Julia benchmarks use the fastest documented containers:
VectorPauliSumwithPerformance.propagate!(development branch 0.8.0 or later) andVectorMajoranaSumwith AcceleratedKernels; the dictionary-backed alternatives are serial. The vector Pauli path does not merge duplicate strings, so its term count is a storage count. - CPU and GPU use different node types, so the
cuPauliPropcomparison includes hardware as well as implementation effects.
Methods
Drivers:
packages/bench-third-party,
a standalone uv project, outside the workspace because it needs CUDA-specific wheels and a
narrower Python range.
Hardware
Different partitions for CPU and GPU, because Leonardo's DCGP nodes have no GPUs.
| Partition | Hardware | Engines |
|---|---|---|
| DCGP (CPU) | 2× Intel Xeon Platinum 8480+, 112 cores, ~480 GB RAM | monoprop 0.8.1.dev61+gcb9a033aa (56 threads), PauliPropagation.jl 0.8.2 on Julia 1.12.6 (28 threads), QuEra ppvm 0.1.0, Qiskit pauli-prop 0.2.0 |
| Booster (GPU) | NVIDIA A100-SXM-64GB, 8 host cores | cuPauliProp via cuquantum-python-cu12 26.6.0 |
Best known configuration each: monoprop on all 56 cores of one socket, PauliPropagation.jl on 28
threads, more reducing its throughput. Every record carries host, threads, library_version.
How memory is measured
Peak resident set size, from the kernel's VmHWM, with shared pages counted in full; peak
device allocation for cuPauliProp instead. Exact, and identical for every CPU implementation over
the timed region, reset per step behind gc.collect() + malloc_trim (GC.gc() for Julia).
native_memory additionally records each implementation's own estimate, comparable only within one
implementation.
Reproducing
cd packages/bench-third-party
uv sync    # monoprop (editable), qiskit, ppvm, pauli-prop, cuquantum-python-cu12

# Julia only for the Julia comparisons
curl -fsSL https://install.julialang.org | sh          # juliaup + latest stable Julia
julia -e 'using Pkg; Pkg.add(["JSON", "ProgressMeter"])'
# Pauli, fixed lattice; edit settings.json to change the model
cd pauli_prop
uv run python run_model.py # CPU engines -> results.json
julia run_model.jl # optional; merges PauliPropagation.jl in
uv run python run_model.py --backends cupauliprop -o results_gpu.json # on a GPU node
uv run python plot_results.py
# Pauli, lattice sweep; 300 s limit per (size, engine)
uv run python run_scaling.py --output scaling_cpu.jsonl --timeout 300 \
--backends monoprop juliapp ppvm qiskit --threads monoprop=56 juliapp=28
uv run python run_scaling.py --output scaling_gpu.jsonl --timeout 300 \
--backends cupauliprop # on a GPU node
# The first input takes precedence when a backend occurs in both files
uv run python plot_scaling.py scaling_cpu.jsonl scaling_gpu.jsonl
uv run python plot_scaling.py scaling_cpu.jsonl scaling_gpu.jsonl \
--memory-key working_set_MB
uv run python plot_speedup.py scaling_cpu.jsonl scaling_gpu.jsonl
# Majorana
cd ../majorana_prop
monoprop_NUM_THREADS=24 JULIA_NUM_THREADS=24 bash run_benchmarks.sh
# Two-panel headline figure from both committed result sets
cd .. && uv run python plot_headline.pyModel parameters:
settings.json.
Output schemas and per-implementation limitations:
packages/bench-third-party/README.md.
Internal benchmarks
A pytest suite measuring runtime and peak RSS of core operations, separate from the functional tests
and run with just bench.
Running
Each run takes a label, naming its column in results/REPORT.md, so configurations sit side by
side. Extra arguments go to pytest.
uv sync --group bench                          # once

just bench serial                              # serial run, column "serial"
just bench-smoke                               # quick sanity check (tiny sizes)
just bench serial --num-modes 64 --bench-rounds 10

monoprop_NUM_THREADS=10 just bench serial-t10  # cap the partition count

uv run --group bench monoprop-bench-report benches/results  # rebuild report, no re-run
Both groups measure the same four operations — build_graph, propagate, energy, gradient:
bench_random.py: a random problem, both pictures.--gen-length(4),--obs-terms(10000),--num-generators(100),--num-modes(128),--cutoff(6),--seed(0),--bench-rounds(1); defaults in parentheses.bench_models.py: two fixed models markedslow, Heisenberg only — a 120-qubit Fermi-Hubbard 29-step Trotter run ([hubbard]) and a 127-qubit kicked-Ising run over 20 layers ([pauli]). Override any config field with--<model>-<field>, e.g.--pauli-num-layers 30;just bench --helplists them.
One group per process at scale: build_graph/propagate and energy/gradient each hold their own
operator, so all four together hold two per rank. Timings go to results/time-<label>.json, the rest
to <label>.json.
MPI
Barriers delimit each timed operation, so runtime is the makespan across ranks. Memory is the sum of per-rank peak RSS: an upper bound, shared pages counted once per rank and rank-local peaks summed even when they never coexisted.
monoprop_PARTITIONS is mandatory above one rank — the engine's default is ranks == 1 ? cores : 1,
which would silently measure one partition per rank — and the declared shape is recorded in meta.
just bench-build-mpi                           # build once (MPI on)
monoprop_PARTITIONS=2 monoprop_NUM_THREADS=2 just bench-mpi r5t2 5 --map-by slot:PE=2 --bind-to core
Benchmarking ladder
benches/LADDER.md holds the development ladder: five groups of configurations, each row's flags
and selector, and the shapes to run them at. Consecutive rungs differ in exactly one thing, so a
regression at one and not the one below names its own cause.
Continuous benchmarking
bench_bare_metal.yml benchmarks every commit on main on a dedicated
RunsOn EC2 node; Bencher records the series and
reports threshold violations. The ladder itself lives in bench.yml. To reproduce a rung locally,
declare its shape and take its selector and flags from the tables below — the label is your own:
export monoprop_PARTITIONS=1 monoprop_NUM_THREADS=1     # the shape, declared
just bench l1-hubbard --bench-rounds 3 -k "test_model_propagate and hubbard"

export monoprop_PARTITIONS=2 monoprop_NUM_THREADS=2     # P sizes the pinning
just bench-mpi l2b 4 --map-by slot:PE=2 --bind-to core
monoprop-bench-bmf benches/results l2b    # results as Bencher Metric Format JSON
monoprop-bench-bmf merges both artifacts: each upload accepts one adapter, and the stock
python_pytest one keeps only timings.
| Measure | Unit | Source | Threshold |
|---|---|---|---|
latency | nanoseconds | pytest-benchmark mean ± 1σ | Student's t-test, upper 0.99, ≥12 samples |
peak-memory | bytes | the process's peak RSS (VmHWM) while the row ran, summed over ranks | +10% |
operation-memory | bytes | what the timed call added above its own floor, summed over ranks | +10% |
terms | count | terms in the evolved operator | any change |
The ~GiB columns below are peak-memory. terms is deterministic for a fixed seed and size, so
any change is an algorithmic one — the only check that a timing win is not an accuracy change.
Timing alerts do not fail the build.
The rungs
Bencher keys history on (branch, testbed, benchmark, measure), so a testbed is one machine and
one shape. It is the rung name up to the first .: <cpu>-<cores>c-<prefix>, from a slugified
brand_raw and the physical core count. On the pinned c7i.4xlarge — 16 vCPU / 8 physical
cores, 32 GiB nominal (~30 usable), no swap — three testbeds:
intel-xeon-platinum-8488c-8c-L1, -L2a and -L2b.
| rungs | testbed | R × P | launch | monoprop_PARTITIONS | rounds |
|---|---|---|---|---|---|
L1.ops, L1.propagate | L1 | 1 × 1 | pytest benches | 1 | 3 |
L2a.ops, L2a.propagate | L2a | 1 × 8 | pytest benches | 8 | 1 |
L2b.ops, L2b.propagate | L2b | 4 × 2 | mpiexec -n 4 --map-by slot:PE=2 --bind-to core | 2 | 1 |
- One node, one MPI-enabled build, so an edge moves the shape and nothing else.
R × P= 8 at both L2 shapes. 4 × 2 pays the per-rank cost four times on one node, so it is the memory-worst shape and the one the size ceiling is set against;P= 2 keeps more than one partition inside a rank, which 8 × 1 would not.- Rounds is 1 above L1 because
pedanticbuilds round k+1's propagator before releasing k's — a memory setting, not a statistics one.
The rows
Two processes per shape, reporting to its one testbed, so all six rows share a plot. build_graph
publishes the graph energy and gradient evaluate, so those three share an operator and the
process peak is the max over them. propagate builds its own, and a fourth row holding its own would
make that peak a sum — at L2 the random row alone is 15.02 GiB on top of L2a.ops's 18.35 GiB
against ~30 usable. The three propagate models do share a process, each releasing its operator when
its row ends.
Selectors: .ops is -k "(test_random_build_graph or test_random_energy or test_random_gradient) and heisenberg",
.propagate is -k "test_model_propagate or (test_random_propagate and heisenberg)". Both take
--num-generators=1000 --num-modes=142 --cutoff=6, plus:
--obs-terms | model cutoffs | |
|---|---|---|
| L1 | 295000 | --hubbard-cutoff=10 --hubbard-lower-atol=4.2e-05 --pauli-cutoff=12 --pauli-lower-atol=1.22e-04 |
| L2 | 2500000 | --hubbard-cutoff=10 --hubbard-lower-atol=6.2e-06 --pauli-cutoff=14 --pauli-lower-atol=2.5e-05 |
L1, at sizes one thread carries, so every L2 row has a baseline below it:
| row | process | terms | ~s | ~GiB |
|---|---|---|---|---|
random build_graph | .ops | 19,902,244 | 54 | 2.56 |
random energy | .ops | 19,902,244 | 5.0 | 2.33 |
random gradient | .ops | 19,902,244 | 13 | 2.48 |
hubbard propagate | .propagate | 9,953,109 | 33 | 0.72 |
pauli propagate | .propagate | 10,069,308 | 25 | 0.92 |
random propagate | .propagate | 19,902,244 | 56 | 2.10 |
Before L1 was split that last row read 3.91 GiB, measured while build_graph's graph was still
resident; on a floor of its own it is 2.10, so peak-memory now means at L1 what it means at L2.
L2a.ops and L2b.ops, ~25 GiB:
| row | terms | ~s 1 × 8 | ~GiB 1 × 8 | ~s 4 × 2 | ~GiB/node 4 × 2 | ~GiB worst rank |
|---|---|---|---|---|---|---|
random build_graph | 167,515,463 | 83 | 19.11 | 68 | 23.71 | 6.14 |
random energy | 167,515,463 | 13 | 17.54 | 6 | 20.36 | 5.17 |
random gradient | 167,515,463 | 39 | 18.85 | 16 | 21.68 | 5.50 |
L2a.propagate and L2b.propagate:
| row | terms | ~s 1 × 8 | ~GiB 1 × 8 | ~s 4 × 2 | ~GiB/node 4 × 2 | ~GiB worst rank |
|---|---|---|---|---|---|---|
hubbard propagate | 345,519,120 | 217 | 17.95 | 217 | 18.72 | 4.68 |
pauli propagate | 253,933,183 | 119 | 21.11 | 120 | 22.15 | 5.67 |
random propagate | 167,515,463 | 58 | 15.02 | 58 | 17.29 | 4.33 |
- Process peaks: 19.11 and 21.11 GiB at 1 × 8, in 135 s and 6:57; 23.71 and 22.15 GiB/node at 4 × 2, in 90 s and 6:59. A testbed's two processes never sum.
~GiB/nodesums the node's ranks and errs high, a page shared between ranks being charged to each: the number to provision against, the wrong one to divide.- Same flags at both L2 shapes, so their term counts must match — the geometry-independence check,
held to 0% by
terms. - The sizes are the largest measured points that fit, swept at 4 × 2. A size past that OOM-kills the
instance rather than the process, taking the artifact upload with it — hence the
catof eachbmf-<rung>.jsoninbench.yml.LADDER.md's own fixed-model rows are sized for a 128-core node, not this one, and its pared L1 row is absent because--pare-thresholdis session-wide.
Inputs
rungs is one rung per line, <name> <ranks> <partitions> <rounds> | <pytest args>: partitions an
integer or per-rank for one per physical core of the rank's share, and a .suffix picking the
process within a shape. A shape that does not fit is refused rather than oversubscribed, and every
rung reads its ranks, partitions_env and thread placement back out of its result JSON. Once a
testbed has history these should stay fixed — a new shape is a new prefix, so a new testbed.
No benchmark workflow gates a pull request. It tracks main, and a threshold is a report, not a
verdict. Each rung's bmf-<rung>.json and raw result JSON upload as an artifact, so a failed upload
does not take the measurement with it.